The US economy grew 2.6% last year. Strip out what the government borrowed in order to produce that number, and it shrank 3.4%.
Both figures describe the same twelve months. The difference between these stories comes down to one question: does borrowed money count as growth in itself?
What appears to be healthy economic expansion in the headline Real GDP statistics can disguise a chronic and perpetual recession in the private sector, running on borrowed time, and heading toward an inevitable economic reset.
This article lays out everything you need to answer that question for yourself:
- What GDP actually measures
- What is left of G7 growth without deficit spending
- Why economic policy is becoming more desperate
- What the central banks are actually doing
- What this means for your money, and the opportunities available
What GDP Actually Counts
Gross Domestic Product is the sum of four things:
1. What households consume
2. What businesses invest
3. What the government spends
4. Net exports (exports minus imports)
Look carefully at the third term. GDP counts government spending in full, regardless of where the money came from or how it is spent. A dollar raised in tax and a dollar borrowed from the bond market are treated identically. Both are recorded as growth in the year they are spent, but government spending leaves behind the burden of interest and capital repayments that is not counted.
So the national accounts have already answered the question on your behalf. Borrowed money counts as growth. That is the whole trick, and it hides in plain sight.
Unproductive spending is not positive for private sector growth. Spending taxpayers’ money on the interest payments for government debt is the clearest case of all. It builds nothing, buys nothing and employs nobody. It is a pure burden on the private sector without any benefit, and these payments are now spiraling out of control.
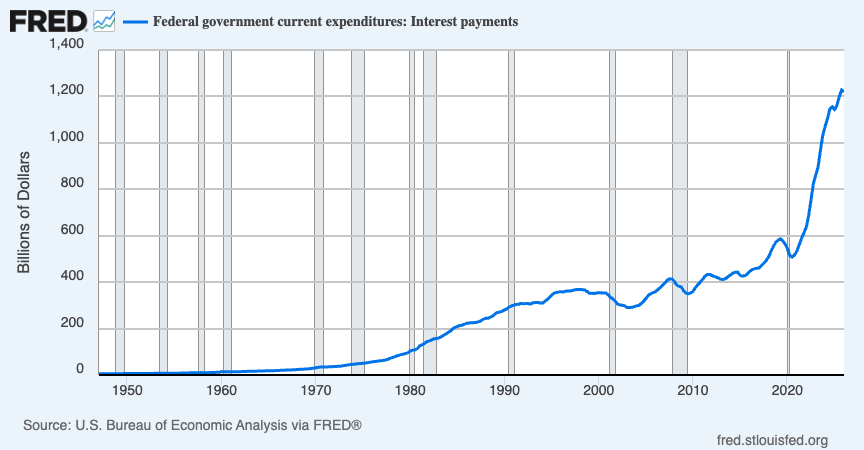
Interest payments alone now run at more than $1.2 trillion a year. The productivity of the rest is debatable. All of it is counted as growth.
Strip Out the Deficit and the G7 Is Already in Recession
Government deficits create additional spending that is not earned out of consumers’ production, and is not covered by their taxes. Take it out of the calculation and you see what the private sector is actually producing.
The table below shows the consequences of that single adjustment across the G7 over the last two years.
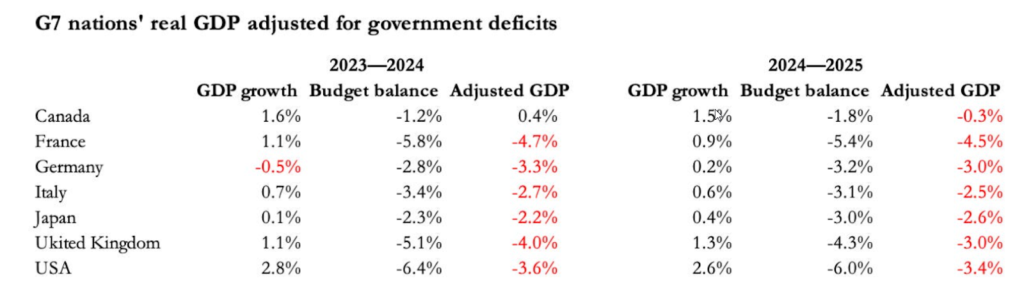
Read the final column. Every G7 nation is negative. The United States reports 2.6% growth and delivers −3.4%. France reports 0.9% and delivers −4.5%. Canada was still marginally positive in 2023–24 and has now joined the rest.
These are not economies that are slowing. These are economies that have been in recession for two years, with the deficit taped over the gap.
Deficit spending does boost activity in the short term. It shows up as corporate revenues and it supports the stock market, which is precisely why reported prosperity and lived experience have drifted so far apart. But the consequences of that spending arrive later, and it has become unsustainable even according to the policymakers running it.
It is worse still when governments debase the currency and underestimate inflation. Real GDP is simply a nominal figure adjusted by an inflation estimate. Understate the inflation and you overstate the growth. Yet it remains vital to sustain the illusion that GDP is growing, because that illusion is the only thing making the debt mountain appear financeable.
We’re Running Out of Duct Tape
If the US economy were genuinely strong, policy would no longer need excessive stimulus. Yet both money creation and deficit spending are accelerating toward extremes.
Money supply is exploding again
US M2 money supply, the broad measure of dollars in circulation (physical currency plus liquid assets), surged $247.8 billion in May to a record $23.1 trillion.
That is the largest monthly increase since May 2021. Year to date, M2 has soared $698.6 billion, the largest January-to-May increase in five years, and money supply now stands $1.3 trillion above the March 2022 peak.
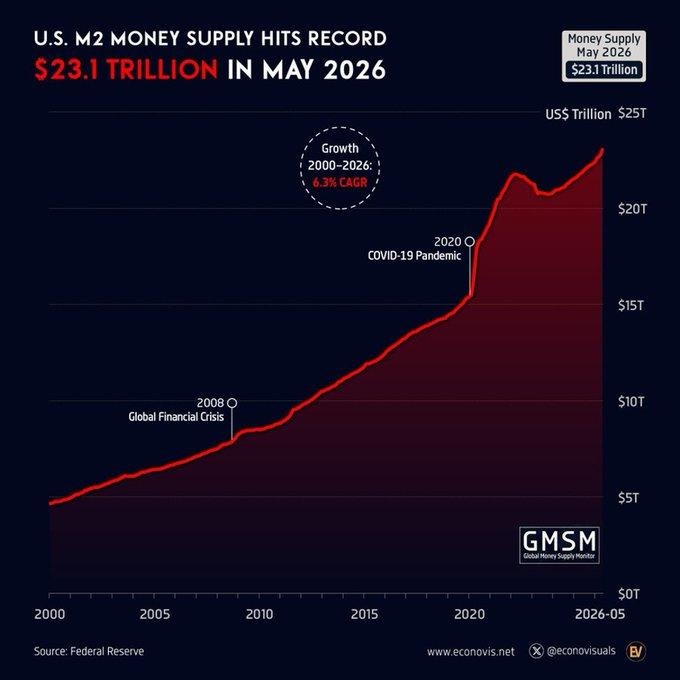
Since 2000, money in circulation has grown at an average annual rate of 6.3%. US money creation is accelerating.
Government has never taken a larger share
The US government has never consumed a larger share of the economy than it does today.
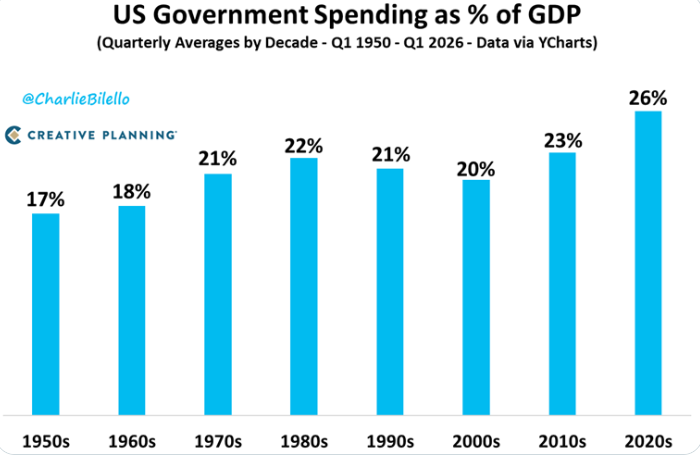
And it is accelerating. The debt ceiling was raised by $5 trillion, and the national debt then rose by $3.2 trillion in a single year.
The buyers are walking away
This is the part almost nobody is watching.
Foreign official holdings of US Treasuries held in custody at the Federal Reserve have fallen below $2.6 trillion. That is a decline of nearly $360 billion since April 2025, and approximately $130 billion since the beginning of 2026. Holdings have now returned to levels last seen in 2010 to 2012.
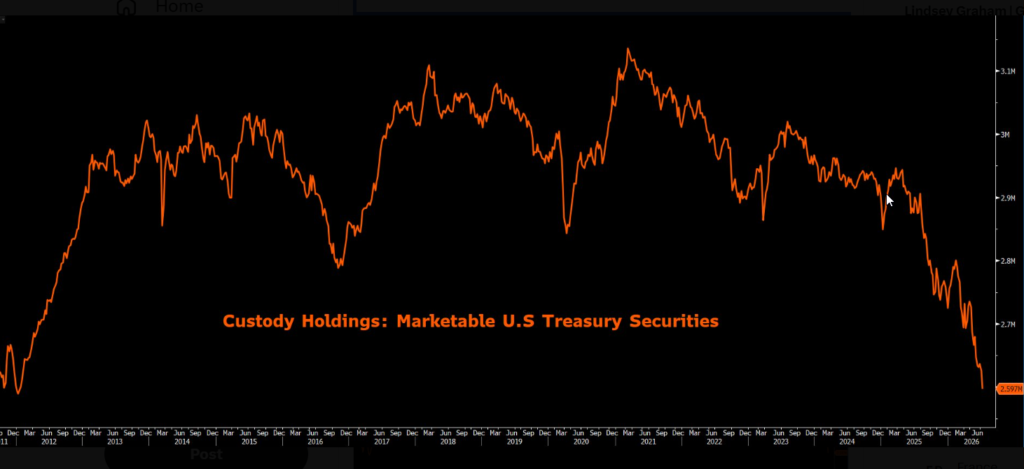
Financing the accelerating supply of bonds is getting more difficult, and quickly. Bond yields are rising. Financing will get harder still. Borrowed growth requires somebody willing to lend.
Consumers are borrowing to stand still
The same stress is now visible in households, where $800 monthly car payments are showing clear signs of strain.
This is precisely what happens during the late stages of a debt cycle. Governments celebrate rising consumer spending while ignoring that it is financed with ever-larger amounts of borrowed money. The economy appears healthy because credit continues expanding, not because the average citizen has become more prosperous. Eventually there comes a point where consumers simply cannot borrow any more. That is when demand collapses, defaults accelerate, and politicians inevitably look for someone else to blame.
History Rhymes
Japan suffered inflation of at least 25% in the mid-seventies, when the wholesale price index rose to 30%. Inflation was already running at over 10% in May 1973, five months before the OPEC oil shock. The Bank of Japan had underestimated the strength of the economy and faced political resistance to a strong yen, and under that pressure it cut the discount rate in mid-1972 when it was already clear the economy was booming.
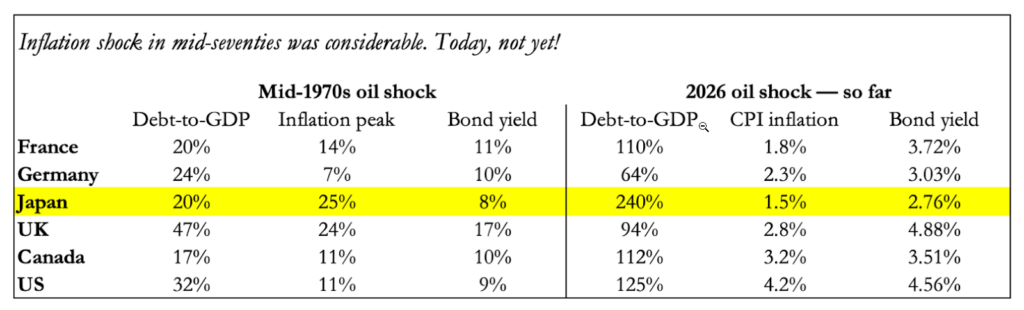
Now look at the debt column. Japanese government debt was 20% of GDP then. Today it is 240%.
These factors are echoed today not just in Japan but across all G7 nations, whose governments are now so indebted that higher interest rates and bond yields are deemed unaffordable, and would be catastrophic for government finances.
This leaves one politically comfortable option. Addressing inflation will be extremely challenging. Defaulting to accepting higher inflation will be by far the most attractive.
This is how fiat currencies collapse.
The Biggest Bubble in History
GDP has never been more inflated by unproductive deficit spending, especially when you consider record interest on debt. Making allowance for that would make the chart below steeper still.
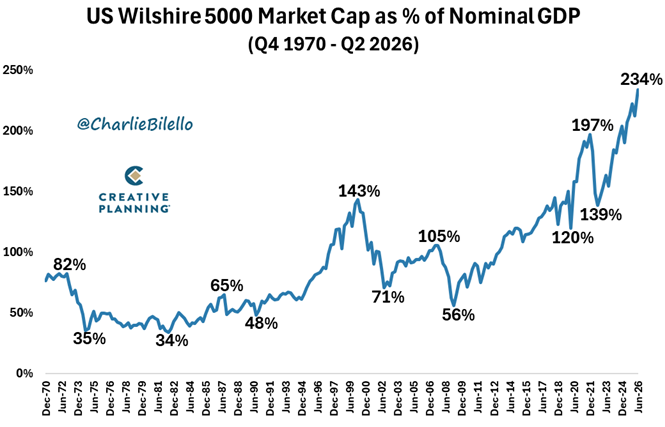
The Buffett Indicator measures the total value of the US stock market against the size of the economy that supports it. It now stands at 234% of GDP.
The high of the 1970s sits roughly 65% below current levels. Realize that the budget deficit was far smaller then, so a fall of that order, back to a prior high rather than to any kind of bargain, could reasonably be regarded as conservative.
The GDP growth scam has created the biggest bubble in US equities in history. The next decade will determine who will remain wealthy and who will be bankrupt.
Watch What the Central Banks Do, Not What They Say
Central banks are the institutions running the fiat currency schemes around the globe. You should watch what they do with their own reserves rather than listen to what they say about yours.
While G7 governments need to sell their bonds and maintain confidence in their economic management, the central banks are swapping reserves out of fiat currencies and their bonds, and into gold.
The latest Central Bank Gold Reserves Survey published by the World Gold Council paints a picture of a sector more bullish on precious metals than ever before. A record 45% of reserve managers expect their own institution to add to its gold reserves over the next twelve months, up from 43% the previous year. Even more telling, 89% of respondents expect global central bank gold holdings to increase over the next year.
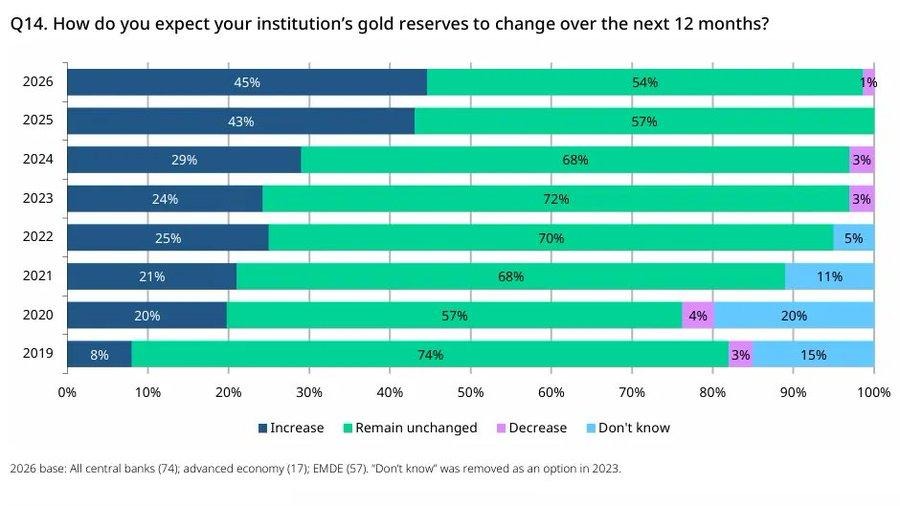
And the most important buyer of gold, China, has been accelerating its purchases straight through the correction in Q2 2026.
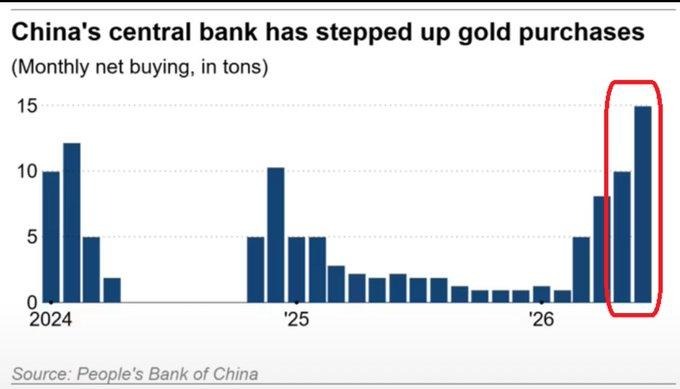
Note carefully what that means. The institutions with the best information about the fiat system, and the most control over it, are steadily reducing their own exposure to it. They are not waiting for the reset to be announced.
What This Means for Your Money
Most financial advisors have not adjusted their strategies to handle the inevitable economic adjustment that the central banks are clearly signaling through their own actions.
Conventional financial asset models can produce disastrous results in the coming fallout. In the 1970s, and again in the 2000s, they delivered more than a decade of losses in real terms. The current starting point is considerably worse than either. These models are not built to see what is happening, and at the moment it matters most they work against your best interest.
Protecting and growing your long-term purchasing power now requires a different allocation, built around the assets that hold their value when the currency does not. I have already adopted this allocation for all of my clients and continue to position for what the market is signaling.
A reset is not only something to be survived. It moves wealth on a massive scale, toward those who prepared and away from those who did not.
The same analysis that identifies this risk also identifies what a correction creates. The 1970s and the 2000s were disastrous decades for conventional portfolios. They were also among the most rewarding periods available to anyone who was positioned before they began. Every major correction in financial history has transferred assets from people who were surprised to people who were ready.
This is a repositioning window, not a reason for despair. The correction is where the next decade of returns is decided.
Very few advisors understand the history of the circumstances we are now in, let alone how to manage them. Follow me on Substack to navigate the immense financial challenges that are now inevitable.
If you would like to compare your allocation with mine, set up a call.
Cheers, Chris