Are Your Returns Above The Line?
The chart above is a representation of risk and return in US securities markets over calendar year 2017. The coloured squares show benchmark results for well known indexes. The green and red circles
Best practices are meant to be shared. That’s why we observe the market and then share our insights on what’s happening, to give you context. We’ve organized every blog into categories, so it’s easier for you to find the answers that matter most to you.
The chart above is a representation of risk and return in US securities markets over calendar year 2017. The coloured squares show benchmark results for well known indexes. The green and red circles
Spectacular equity gains have a fragile and weak fundamental basis. Primarily based on a massive debt explosion favoring equities. Corporate earnings broadly unchanged over the last 3 years Job gains
Since 2000, growth has become increasingly dependent on explosive growth in Federal Debt. GDP Minus Annual Federal Debt, is turning down again. While anchoring is a very understandable behaviour or
Some pictures make you stop and think. Last month King Salman became the first king of Saudi Arabia to travel to Moscow and he bows to Putin. He also brought
The chart above shows the extraordinary extent of the rally from 2009 both in time and magnitude . The ratio of the S&P 500 to its own volatility, VIX, shows
Part 1 – The best assessment of Investment Management is not Returns. Chasing past returns can be disastrous. So just looking at historical returns can lead to big problems.
In Part 4 I will show what I believe is the path to further improvements to RVAR through making a shift to Active Asset Management with tactical allocation models. The
Investment Management: Why You Need A Complete Rethink. Part 1 – The best assessment of Investment Management is not Returns. How can you judge whether your returns or any investment manager’s returns
Credit Growth Weak This Cycle And Now Falling Number of OECD countries with inflation below 2% is continuing to trend higher! How can the Fed possibly unwind QE? Jim Rickards
Central Bank domination of Economic policy and markets continues and accelerates Creates escalating economic and market dysfunction Unprecedented challenge for long term investment Yield curve and TIP suggests policy is
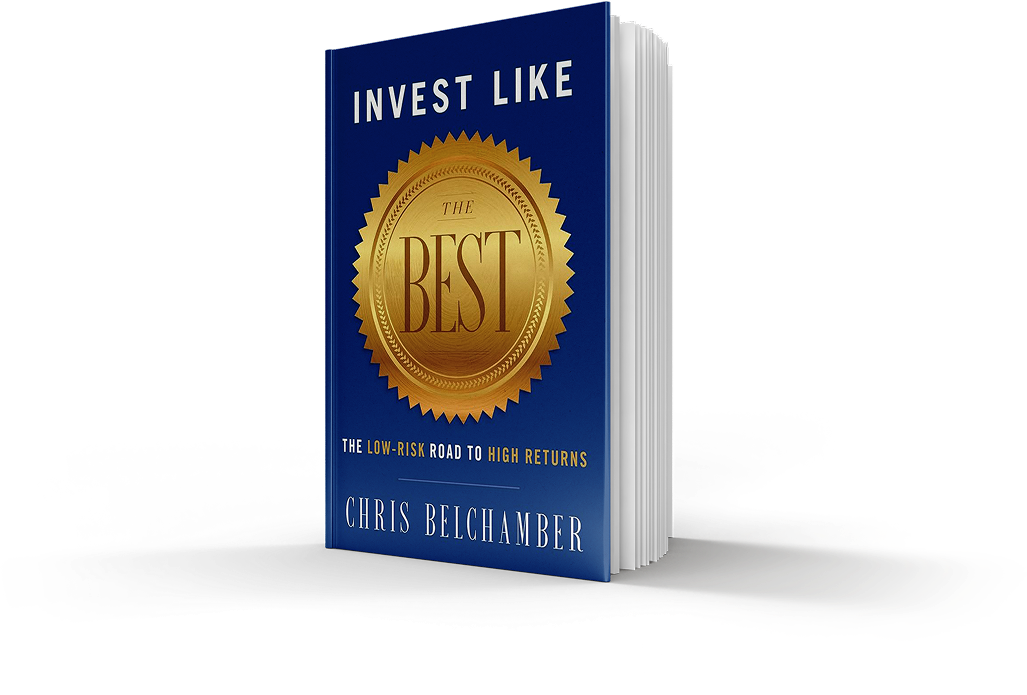
Invest Like The Best reveals the proven strategies of the world’s top investors, showing you how to achieve higher returns with lower risk through disciplined, data-driven decision-making. If you’re ready to break free from conventional, flawed financial advice and take control of your wealth with transparent, repeatable best practices, this book is your roadmap to smarter investing.