With Best Investor Standards and an understanding of policy and debt dynamics you can win in the investment game. Learn how to get higher long term returns through taking less risk. Yes, I can show that is not only possible, it’s even a natural function of market mathematics.
Alasdair Macleod
The debt bubble is driven by the those that benefit and will be bailed out or escape the consequences. It is down to you to protect yourself from this complicated long term predicament. Make sure you have a full cycle strategy that can navigate through the most challenging and unprecedented conditions of your investment life time. Turn risk into opportunity.
In 2008 many banks went from bankrupt to bonuses in around a month.
“In the wake of the 2008 Financial Crisis, former chief economist of the IMF Simon Johnson warned that the same dysfunctional policies he saw in his basket case banana republics had taken hold in the United States.
Johnson warned that if America didn’t act fast, we would plunge into a quiet coup as the American financial system effectively captures the government, bailing itself out until we run out of money.
Because these elites know they’ll be bailed out, they take excessive risks in good times.”
Any system can always be corrupted by incentives.
The Fed was put in place after the 1907 crash. J P Morgan did not want to have to arrange the bank bailout he was forced to do ever again. What was less understood is that once you have a Federal Reserve to bail out banks, then the incentives change. Then over time the behavior of participants changes.
If you don’t face consequences when you fail, and you still get a bonus, then what kind of system do you really have?
It turns out that you have an exponentially exploding debt crisis. Bailed out entities create massively leveraged debt and get high rewards, without consequences and someone else pays. Guess who pays?
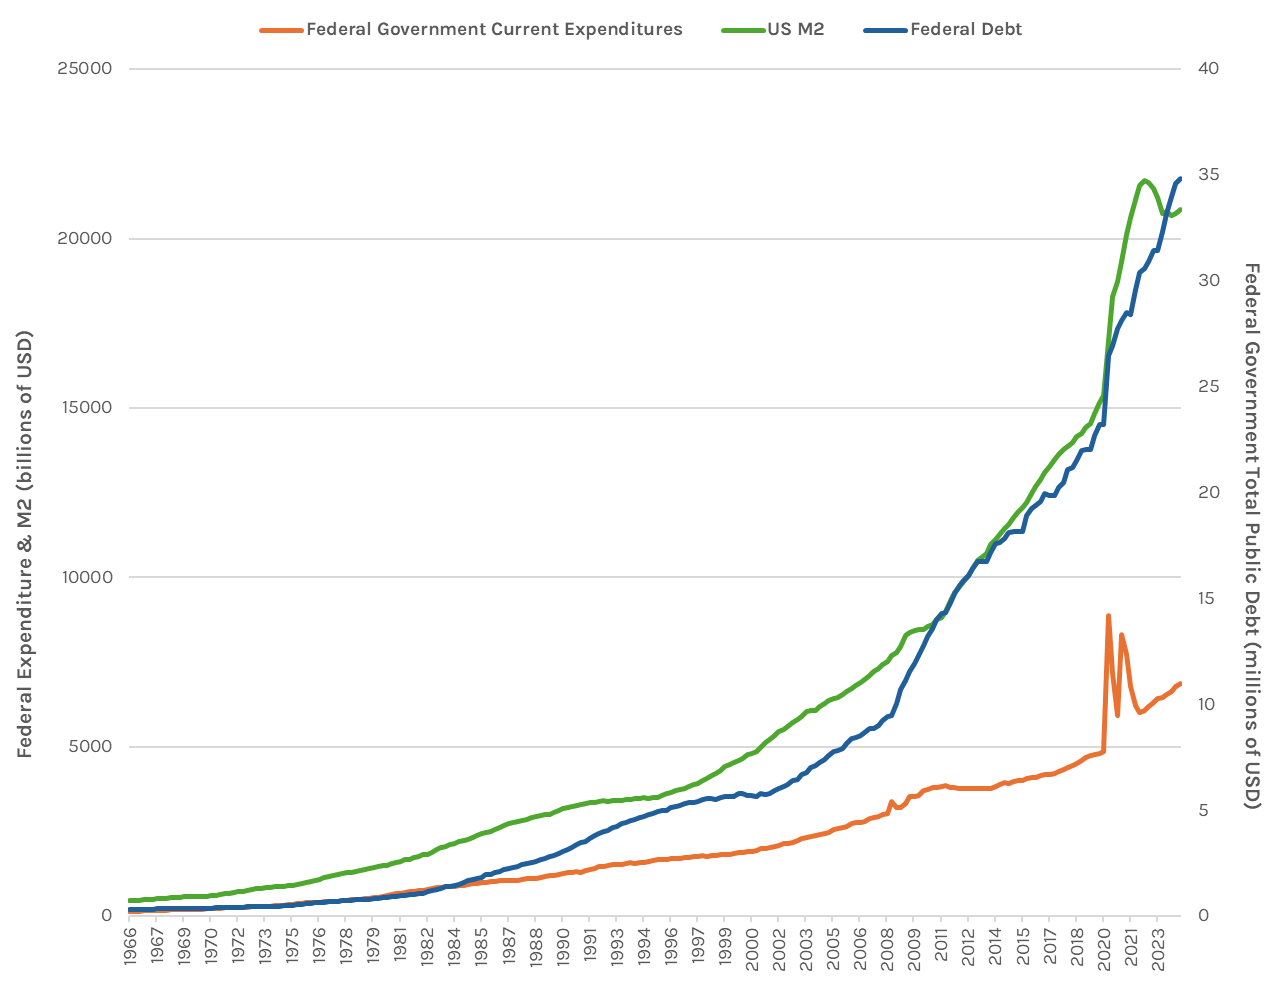
The chart above shows that once these new incentives drive the markets, it is no longer a level playing field. Along with excessive debt, market function, opportunity, economic behavior and the integrity of the currency system spirals down.
We have already seen policy go off the rails as it attempts to extend the unsustainable.
The chart above shows breathtaking exponential explosions in both money supply and government debt far beyond the basic expenditures of government. We analyze this in more detail below.
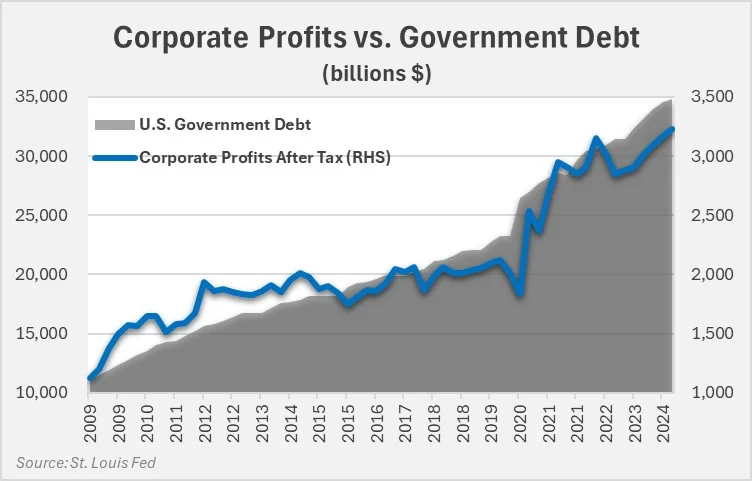
Corporations find out it works for them too.
Excessive debt and money supply brings forward demand and boosts profits. Then buybacks can boost the stock price too, which is great for compensation in stock options.
This has gone on so long it seems like it can go on for ever. Hey, the CBO says our $35 Trillion in government debt will be $50 Trillion in a decade or so, and no one seems to talk about it as an issue.
Policy support is getting bigger while having less of an effect. This means the crisis is accelerating.
Yet another round of massive support has just started towards the end of Q3 2024.
In Q3 2024 the world economy once again needed another debt reboot from chronically weak global growth. In August the US produced the biggest budget deficit ever for that month of nearly $400 Billion. Then the Fed aggressively cut interest rates, followed shortly by a massive commitment by China to achieve 5% GDP growth in short order.
Beyond that September was a near record easing month by global central banks.
Can central banks save the day?
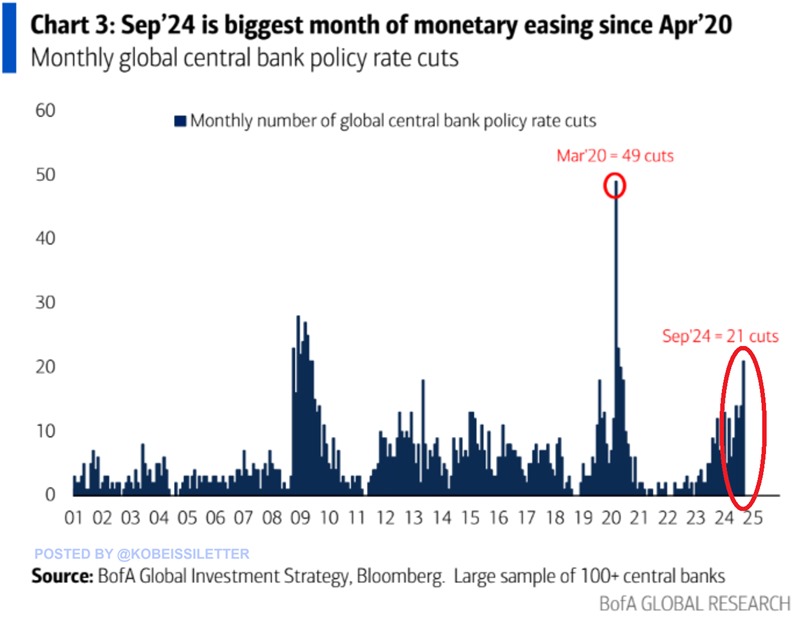
Liquidity doesn’t get much stronger than this.
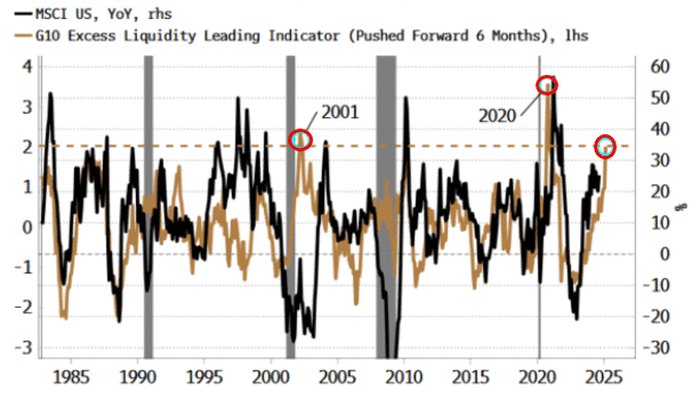
This should put a floor under growth for now just as inflation is nearing a trough in the cycle. The world may well experience rising growth and inflation in Q4 2024.
Allocation preferences have been changing rapidly over the last two weeks, for example healthcare has weakened as commodities have strengthened. The most significant change may now be for rising inflation after later this year.
The Inescapable math of a debt trap
More specifically than growth in GDP, what matters is the growth in tax revenue required to fund the pace at which the combination of debt and interest is being rolled over. In Europe and the UK, tax rates are already so high that attempts to obtain more revenue by increasing them will almost certainly lead to lower revenues due to the Laffer curve effect. The US is probably not at that point yet tax-wise, but economic stagnation has the same effect.
The following chart illustrates government indebtedness relative to GDP for the G7 nations and also relative to private sector GDP, which produces the revenue for governments upon which debt credibility depends.
How did governments cut the debt-to-GDP ratio following WW2?
Much of the complacency over government debt levels arises from the fact that high WW2 debt levels were reduced over the following two decades to manageable levels, fuelling a belief that it can be done again. America’s government debt to GDP in 1946 peaked at 120%, below current peace-time levels, falling to 35% in 1971 when Nixon suspended the Bretton Woods Agreement. The relevant figures are shown in the table below.
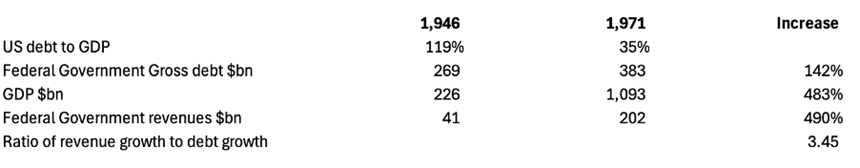
The increase in gross Federal debt was 142%, but the increase in GDP was 483%. And the increase in revenue, which ultimately pays for the debt was slightly more than the increase in GDP. Therefore, revenue growth outpaced debt growth nearly three and a half times, leading to a significant reduction in debt to GDP. This was how the war debt relative to GDP was reduced, before the discipline of gold on government spending and interest rates was finally abandoned.
This millennium is different from the post-war years
The next table replicates the first table in this article, but for the 24-years of this current millennium.
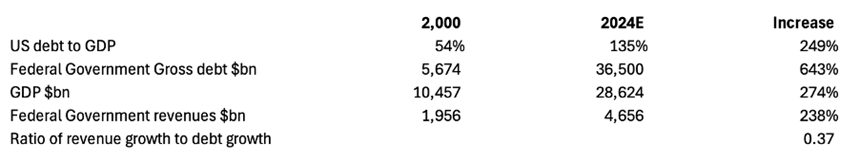
Here, we can see that gross debt is soaring at a far faster rate than GDP, and even more so measured in the Federal Government revenues which are behind the sustainability of the debt. With the increase of revenue only covering 37% of the debt increase, the US Treasury is in a classic debt trap; a fact which is increasingly recognised by foreign central bankers who are getting out of dollars and into gold.
Summary
The whole purpose of examining policy and economic analysis is to focus on understanding, in a realistic way, how to navigate the news and markets. I am primarily an asset manager, not an asset gatherer. This means that my primary purpose is to be realistic and perform not necessarily to make people feel happy. That being said I need to describe solutions too. So, let’s separate out critique from solutions.
Critique
It is easy to see that the debt bubble is far more troubling than at any time during the post-war years. The relationship between debt and tax revenues should be alarming. as regards sustainability and stability of current conditions.
If inflation rises again, as is likely next year, the Treasury market could change the ability of policy makers to control the situation.
Given the negligence of congress on this issue, only the markets will force a change in circumstance. Crisis first, and then hopefully a solution will follow.
Solution
Conventional and simplistic investment strategies will likely be significantly challenged in the near future. The ideal investment management solution is to turn the markets into a safely compounding result that can address unsustainability and and instability. This is what the most successful asset managers have been able to produce over multiple decades.
This requires a wholely different approach from standard asset management methodologies. For an introduction to this approach view the following link: