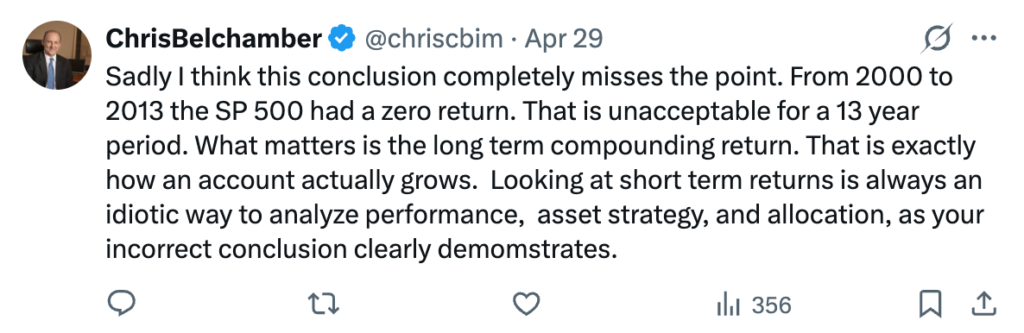
A few weeks ago I saw a tweet that I just could not let go.
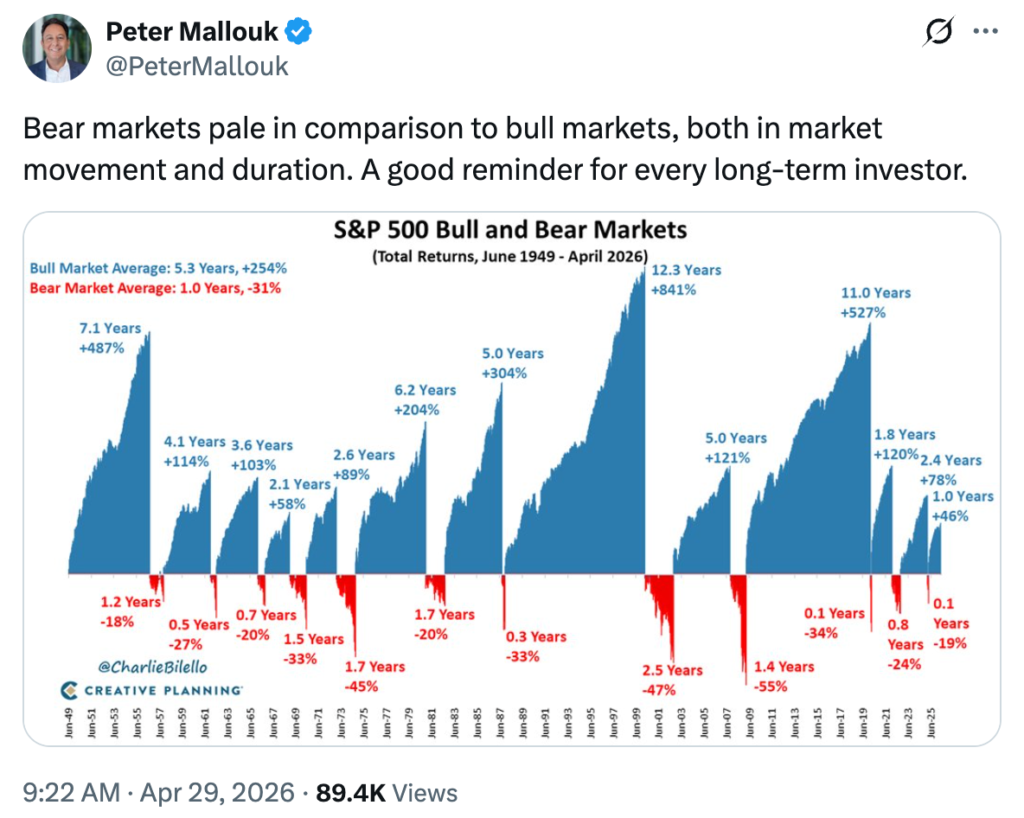
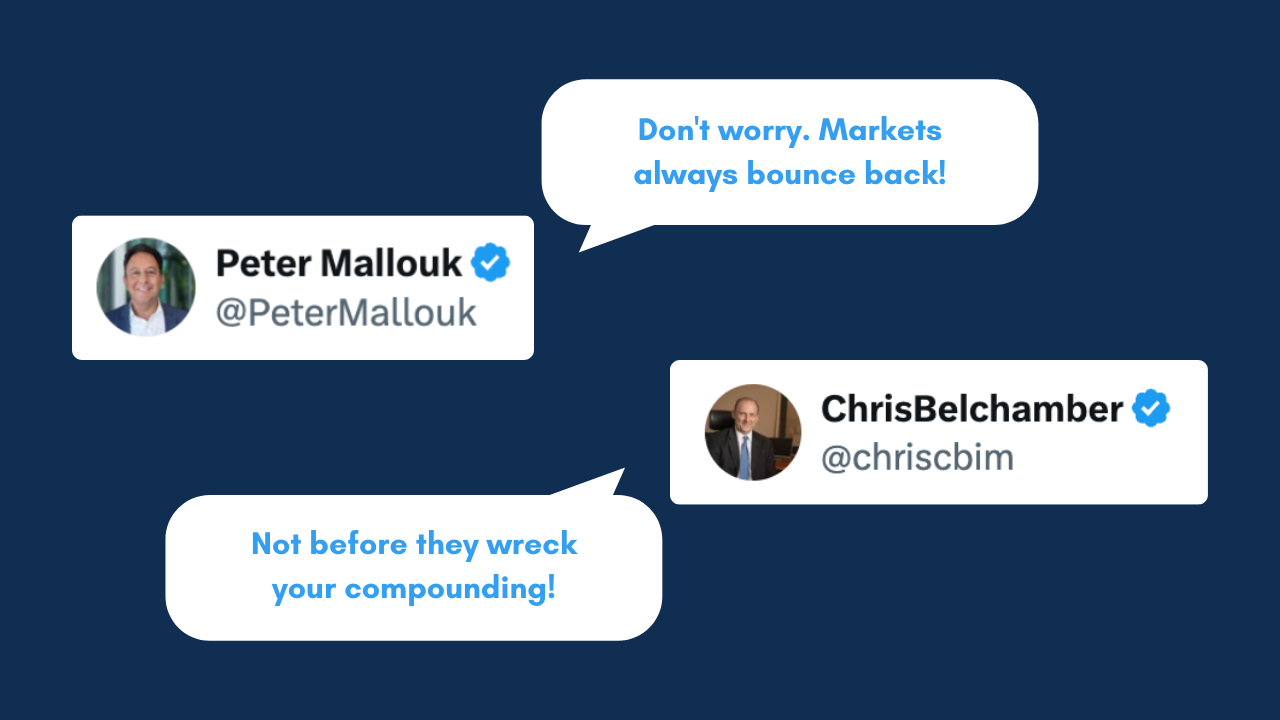
It came from one of the most followed financial advisors in the country, and it had already racked up 80K views by the time it crossed my feed. The chart showed every bull and bear market in the S&P 500 since 1949. The message was confident and reassuring: “Bear markets pale in comparison to bull markets, both in market movement and duration. A good reminder for every long-term investor.”
The implication was clear. Drawdowns don’t really matter. Stay the course.
I read it and my stomach turned.
That tweet is mathematically wrong, and the conclusion it leads people to is dangerous. I replied saying so.
But the reply isn’t the point of this article. The point is that this kind of reassuring, popular, mathematically incorrect messaging is everywhere. It comes from people with hundreds of thousands of followers. It comes from firms managing tens of billions in client assets. And it shapes how millions of ordinary people make decisions about their retirement, their home, and their family’s future.
I’ve been watching this pattern for months and the problem is far more widespread than I had realized. That is why I am becoming more active in writing about it. Investing has been my life’s work, and the gap between what most investors are being told and what is actually true about long-term returns has become impossible to stay quiet about. Helping people see that gap clearly is, for me, a way of serving them in the way they deserve to be served.
This article is about why messaging like that tweet is wrong, what the math actually says, and how you can find out whether your own advisor understands the difference.
Why “Best Interest” Matters More Than “Fiduciary”
Most financial advisors will tell you they are a fiduciary. It sounds reassuring, and the intention behind it is good. A fiduciary has a legal and ethical duty to act in your interest rather than their own.
But intention is not the same as outcome.
A fiduciary who genuinely means well can still give you advice that fails you. Consider an advisor who:
- does not understand how compounding actually works in a real portfolio
- cannot explain what your drawdowns are costing you
- cannot show you a track record correctly measured against the right benchmarks (S&P 500 is only the right benchmark for equities, and 100% equities is an extremely risky allocation)
Their good intentions are not going to protect your money. The duty has been technically met. Your Best Interest has not.
That is why I prefer to use Best Interest as the standard rather than fiduciary. Best Interest is fact-based. It’s adaptable to what actually matters to each individual client. It’s measurable in your own account, on your own timeline, against your own goals. And it does not let anyone off the hook for being well-meaning but wrong.
The harder truth is that because so much investment advice falls short of this standard, the burden of ensuring your Best Interest lands on you. Not your advisor. You. That is not the way it should be, but it is the way it is, and pretending otherwise is how people end up with thirteen-year zero returns.
So the question every investor needs to be able to answer is this. Can your advisor demonstrate, with real numbers from real accounts, that what they are doing is actually in your Best Interest?
To answer that, you need to understand the one thing the entire industry confuses.
Compounding Reveals The Truth
Here is a simple test. Below are five years of annual returns from three different asset managers. All you know about them is what they delivered each year. Take a moment to look at the numbers and pick which manager you would have wanted running your money.
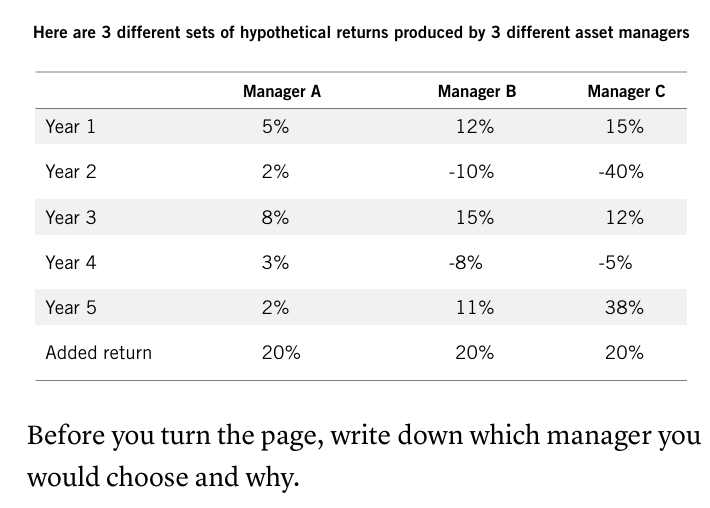
Add up the annual returns and all three managers come to the same number. Twenty percent over five years. If you stop there, you might conclude they performed about the same. You might even prefer Manager C, who delivered the biggest single-year win.
Now look at what actually happened to the money.
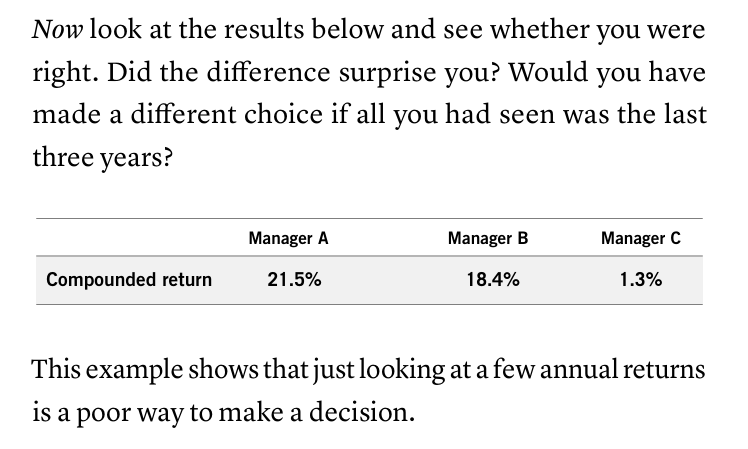
Same sum. Wildly different outcomes. Manager A grew the account by more than sixteen times what Manager C did. The lowest-risk, most boring set of returns produced by far the best result. The most exciting one, with the headline 38% gain, produced almost nothing.
This is not a trick. It is how compounding actually works and so also your account.
The reason Manager C ended up with almost nothing is the -40% year. The managers who minimize drawdowns are the ones who deliver the best long-term compounding, with the least risk and the highest returns. That is not a tradeoff. It is the same outcome, achieved by the same discipline. Avoiding deep losses is not a defensive posture. It is the single biggest driver of long-term performance.
This is why the only number that genuinely describes your investment performance is the long-term compounded return. It is the only number that uniquely and exactly matches what your account is actually doing. Annual returns, three-year returns, “average” returns, sums of returns are all partial views. They allow investors to hide behind false narratives.
And it is why the people Wall Street tells you to admire, the high-conviction, high-volatility managers who post the biggest single-year wins, are very rarely the ones who actually grow their clients’ money over time. The boring ones win. They win because they protect against the drawdowns that destroy compounding.
Hold onto this picture. Let’s get back to the tweet.
What The Tweet Got Wrong
Now we can look at the original chart with clear eyes.
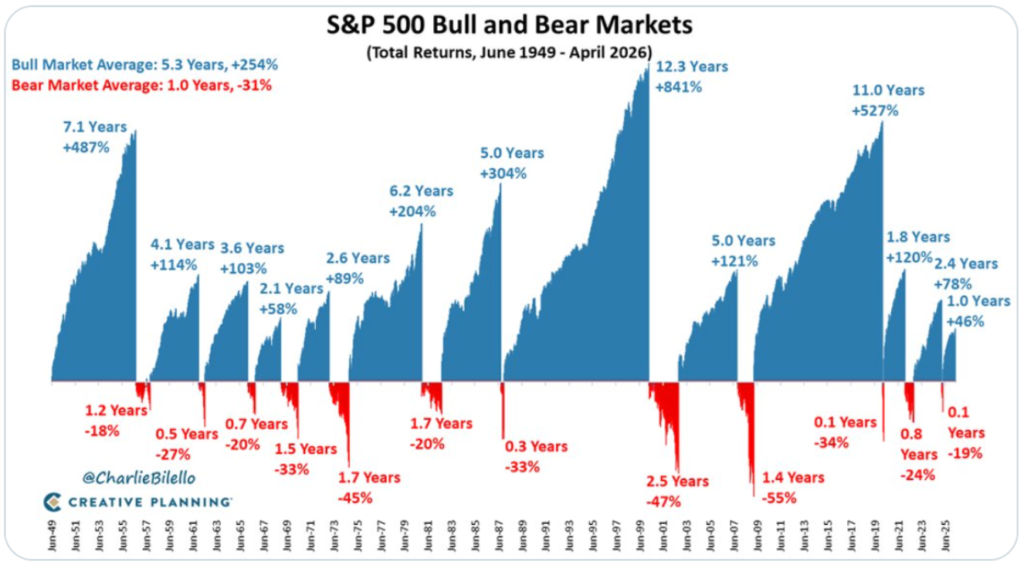
The chart shows every bull and bear market in the S&P 500 since 1949. The bull markets average 5.3 years and 254% gains. The bear markets average 1.0 years and 31% losses. Visually, the blue is much bigger than the red. The conclusion the chart leads you to is that the bull markets so dominate the bear markets that you can effectively ignore the drawdowns.
That conclusion is wrong, and it is wrong for the same reason Manager C lost to Manager A. You cannot cut and paste returns from different periods and add them up. That is not how compounding works. The visual comparison of bull-market gains against bear-market losses tells you almost nothing about what an actual investor experienced.
Look at what really happened during one of the periods compressed inside that chart.
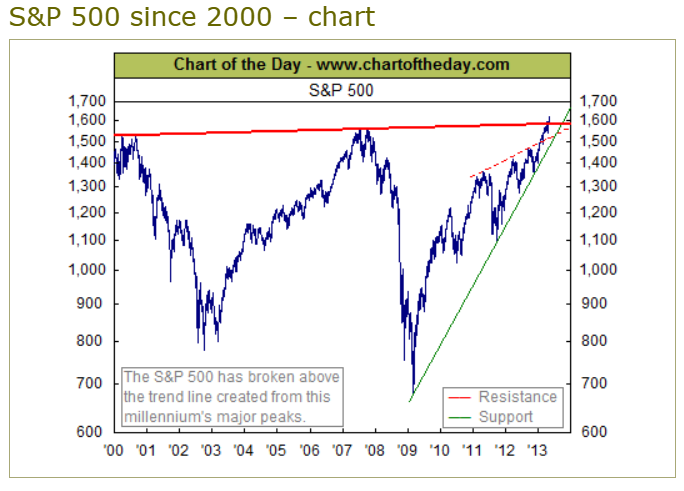
From 2000 to 2013, the S&P 500 went sideways. Thirteen years. The market was rallying for roughly nine of those years and in drawdown for less than four. By the chart’s logic, that should have been a great period for investors. The bull markets were three times longer than the bear markets.
The actual return over those thirteen years was approximately zero.
Two major drawdowns, the dot-com crash and the 2008 financial crisis, erased every gain the rallies produced. In 2013 the index was roughly where it had been in 2000. An entire investing decade and a half delivered nothing, because the drawdowns did the compounding damage we just walked through. They reset the base. The rallies that followed had to climb out of a hole before they could create any real growth, and there was not enough time for them to do it.
This is exactly the experience the original tweet implies you do not need to worry about. And this is exactly the experience that destroys retirement plans, college funds, and decades of disciplined saving.
The original chart was not just a casual oversimplification. It was advice. It reached 89,000 people. It told them that drawdowns are not a serious concern for long-term investors. The historical record says the opposite. The investors and managers with the smallest drawdowns are the ones who actually compound their money. Everyone else is gambling on whether the next sideways decade arrives before they need their portfolio.
Does Your Advisor Actually Understands This?
What we just walked through is not a small or technical disagreement. It is the whole game. When an advisor or manager underestimates the role of drawdowns and the role of compounding, two things happen to their clients, and both are bad.
The first is the client gets exposed to catastrophic loss. The second is the client experiences long-term underperformance through inferior compounding, often without ever realizing it. One of these failures is dramatic and the other is quiet, but they both flow from the same blind spot, and they both violate the client’s Best Interest.
The good news is there is a simple way to find out where your own advisor stands.
Ask them for the Calmar Ratio for an account they manage, and ask how it compares to a range of benchmarks.
The Calmar Ratio measures compounded return against the worst drawdown an account has experienced. It tells you how much actual growth a manager produced for every unit of pain their clients had to absorb. It is the cleanest single number for assessing whether a manager is genuinely compounding or just riding the market and hoping the next big drawdown does not arrive before their clients retire.
You can track the Calmar Ratio over any period. It is your real-time report card on whether your compounding engine is running smoothly.
I want to be clear that this is not a theoretical concern. A prospective client recently told me they had asked their existing advisor about drawdowns in their portfolio. The advisor’s response was a question of their own. What’s “drawdown”?
This is a person managing real money for real families. They had not encountered the basic vocabulary required to even begin the conversation, let alone produce a Calmar Ratio. If your advisor does not know what drawdown is, they cannot possibly be optimizing your compounding, because they do not know what they are supposed to be minimizing in the first place.
If your advisor cannot produce a Calmar Ratio, or does not understand the question, you have your answer. They are not focused on the metric that actually determines your long-term outcome, and there is no version of “Best Interest” that survives that.
If they do produce one, you now have something concrete to hold them accountable to. You can compare it to benchmarks. You can track it over time. You can ask them to explain why their number looks the way it does. The conversation moves from vague reassurances about “long-term investing” to a specific, measurable record of how they have actually managed risk.
For a more complete walkthrough of the four key compounding assessments and how they fit together, I have written a full breakdown here: The Discipline That Separates Investors From Gamblers.
Your Best Interest Requires Your Attention
The hard reality is that no one is going to enforce your Best Interest for you. Not the regulators, not the fiduciary label, and not the most followed advisor on social media.
It should be mandatory for every advisor to provide clear drawdown objectives to their clients, and to publish a track record showing how those objectives have been met. It is not. So the bar an investor has to apply is higher than the one the industry currently sets for itself.
If you are working with an advisor today, the standard I would suggest is this. Ask for at least three years of Calmar ratio data on accounts they actually manage. Ask how it compares to the relevant market benchmarks. Ask them to explain, in plain language, how they think about compounding and drawdowns. If they cannot meet that bar, you have learned something important, and you have learned it before another sideways decade or another major drawdown teaches it to you the painful way.
Compounding is the most powerful force in your portfolio’s long term performance. Optimizing it is the most important thing your advisor can do for you. Anyone who treats drawdowns as a minor consideration, or who cannot show you the key metrics, is not protecting it.
Your Best Interest requires your attention and vigilance. Nobody else can do it for you.
If you would like to review your investment approach against these standards, set up a call.
Cheers, Chris.