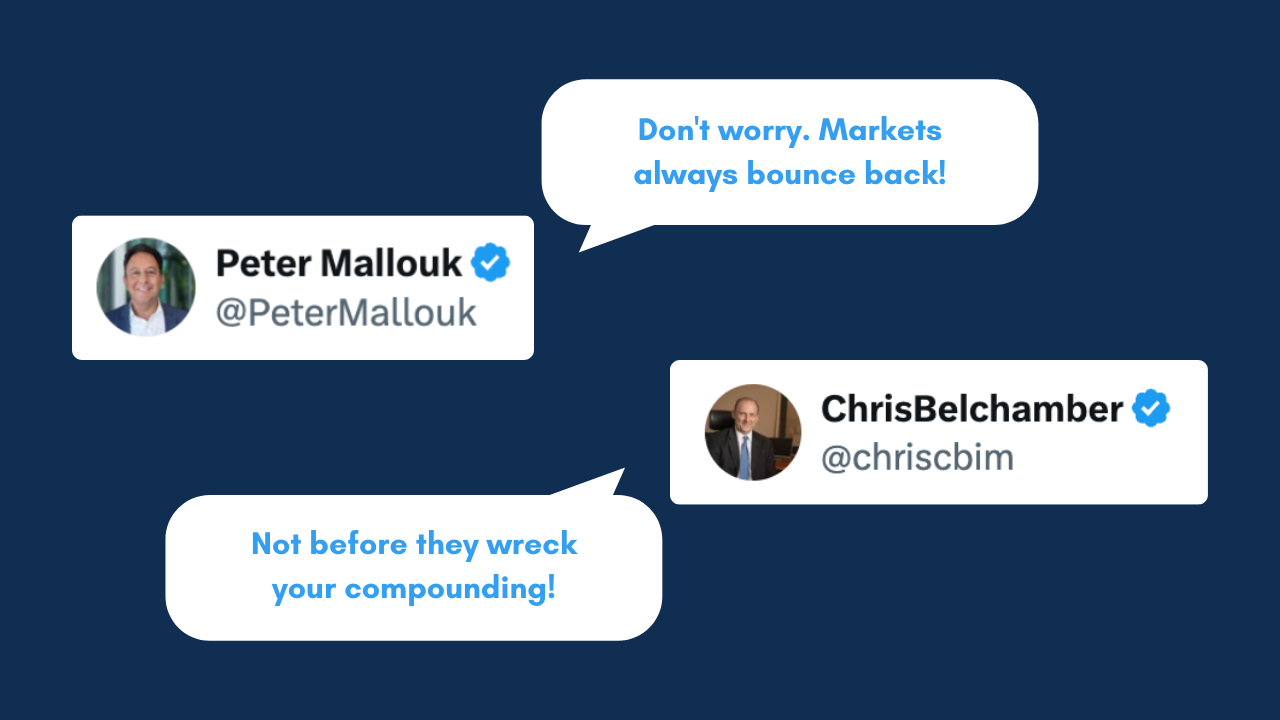
The warning signs are no longer subtle. The Everything Bubble—fueled by record valuations, relentless leverage, and decades of policy intervention—is now pressing against its limits.
Markets can stretch for a long time, but every cycle has a point where fundamentals stop supporting the story. We’ve now arrived at that moment.
We emphasized this in our article a month ago, and it bears repeating with even greater urgency:
This is the biggest investment event of your lifetime!
But the message isn’t about fear. It’s about recognizing a pattern we’ve seen many times before: when valuations disconnect this dramatically from reality, the correction that follows is about how quickly investors adapt.
Two forces in particular are now converging:
- Valuations at historic extremes
- Leverage at unprecedented levels
These are not isolated developments. Together, they mark the setup for a structural shift in markets, the same kind of shift that defined every previous Capital Rotation Events (CREs) of the last century.
As J.P. Morgan observed long before the era of financial engineering:
“Gold is money. Everything else is credit.”
The system is, once again, reminding us why he was right.
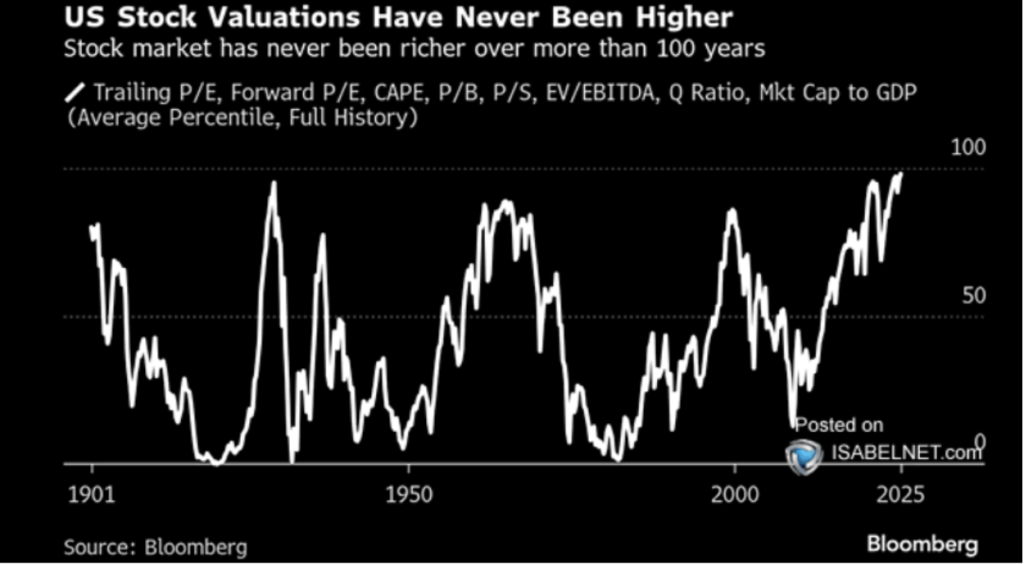
Valuations Are at Historic Extremes
The first and most obvious sign that the Everything Bubble has hit its limit is valuation itself.
By almost every major measure, the U.S. stock market now sits at levels that exceed not only prior bubbles, but more than a century of financial history. These aren’t marginal differences. They represent a structural detachment from fundamentals that has historically preceded long, grinding periods of poor real returns.
High valuations don’t predict the exact moment a market resets, but they do define the decade that follows. Markets oscillate between overvaluation and undervaluation, and from today’s extremes there is a long way down.
But valuation excess is only half the story. The other half is how heavily investors have positioned themselves inside it. U.S. households now hold more than 50% of their total financial assets in U.S. equities, the highest concentration ever recorded.
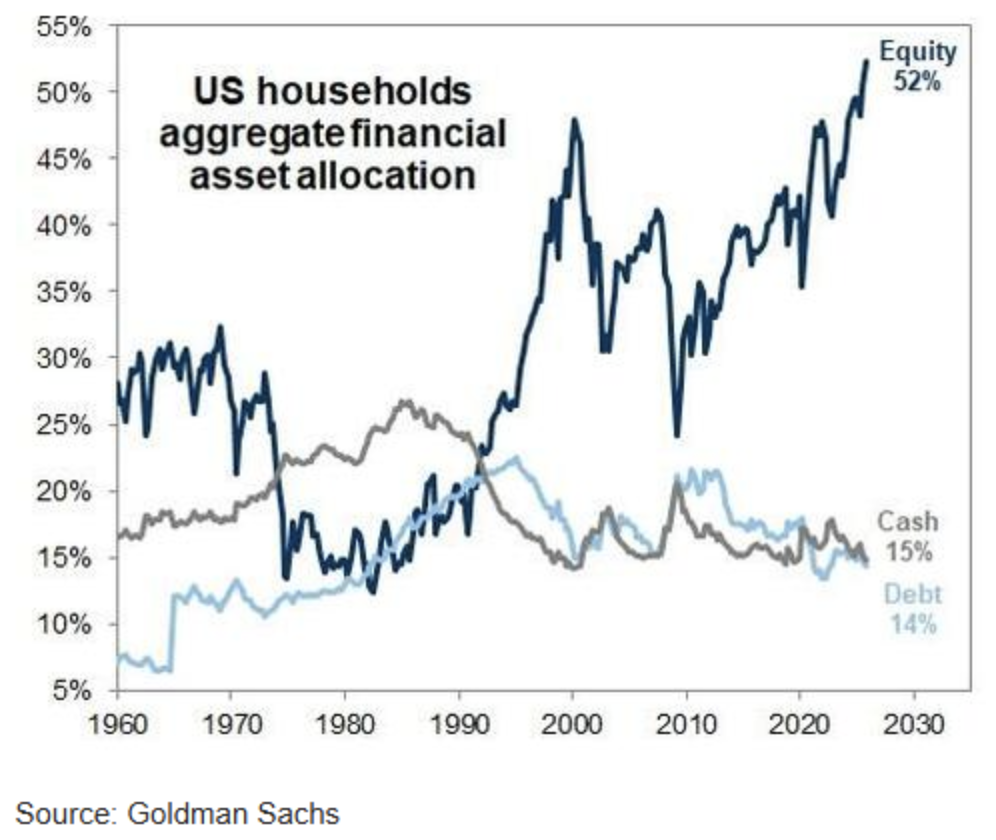
This level of exposure means the average investor is not simply optimistic about U.S. stocks; they are structurally dependent on them. When the majority of wealth is tied to the most overpriced assets in history, even a modest valuation shock can have outsized effects.
Record valuations combined with record allocations create a feedback loop with almost no margin for error. Prices have been driven forward by enthusiasm, leverage, and liquidity, not sustainable earnings growth.
The math is clear. When markets reach this extreme end of the CAPE spectrum, the expected 10-year real return collapses toward zero or even negative territory. A century of data shows the same downward slope: no matter the narrative of the moment, starting valuations dictate long-term outcomes.
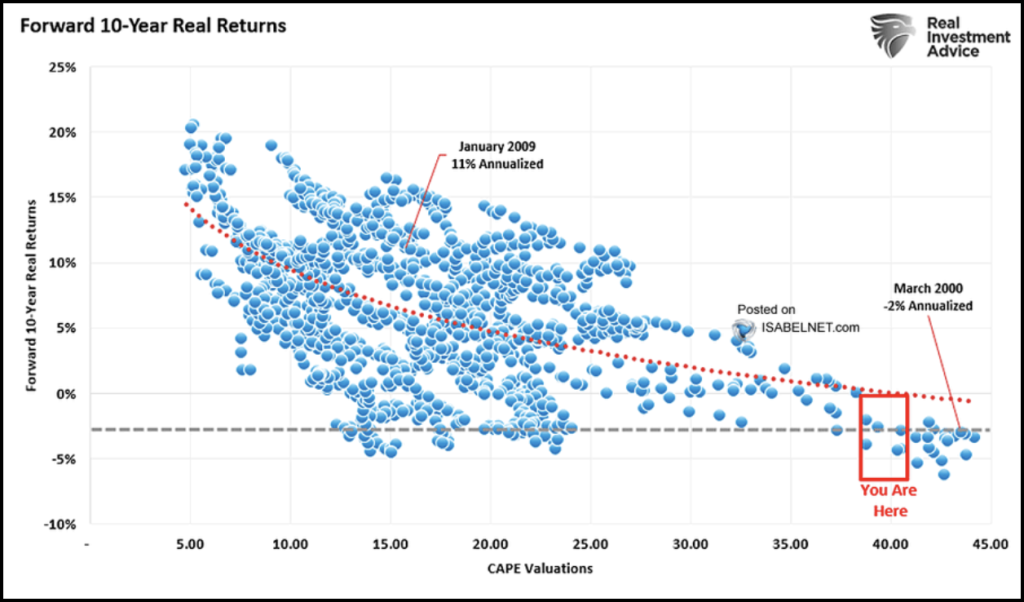
This is the quiet danger of the current environment. Investors aren’t just overexposed to stocks; they’re overexposed at the exact moment when the math turns against them.
No amount of optimism or narrative can change what high starting valuations imply: when you pay too much, you give away the next decade’s return before it even begins.
Leverage Has Never Been Higher
If valuations show how stretched prices have become, leverage shows how dangerously those prices have been reached.
Margin debt—the amount investors borrow against their portfolios to buy even more stock—has surged to record highs. Margin allows investors to control positions far larger than their actual cash, amplifying both gains and losses. When markets rise, leverage accelerates the climb. When markets fall, it forces selling.
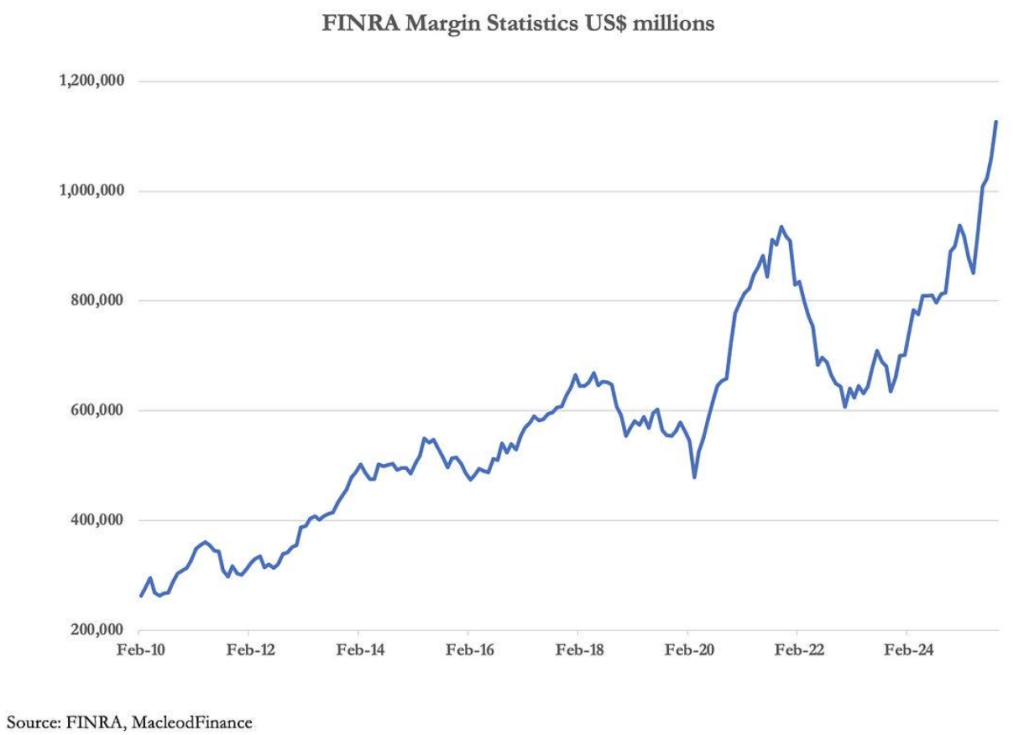
Today’s margin levels are not just high; they have reached an all-time peak. This is the same dynamic that intensified the declines in 2000 and 2008. The higher the leverage, the thinner the buffer when volatility returns.
And leverage isn’t limited to household investors. Corporations have doubled down on it. Companies have been aggressively buying back their own shares, boosting stock prices with borrowed cash.
According to Goldman Sachs, authorized buybacks through October have reached $1.2 trillion, up 15% from the same period last year.
Buybacks inflate earnings-per-share and support valuations in the short term, but they also increase corporate indebtedness and bind future performance to continued financial engineering.
Both forms of leverage (household margin and corporate buybacks) push asset prices higher while increasing the fragility beneath them. They create markets that look strong on the surface but are structurally dependent on borrowing.
Why Gold Should Be the Lens for the Decade Ahead
When valuations and leverage reach this level, traditional measures of the market stop giving reliable signals. Everything looks inflated because everything is inflated.
The question becomes simple: how do you measure what’s real?
Gold provides that clarity.
It isn’t a projection, a policy decision, or a liability. It doesn’t default, dilute, or depend on confidence. It sits outside the credit system entirely.
The more the system leans on credit, the more important that distinction becomes.
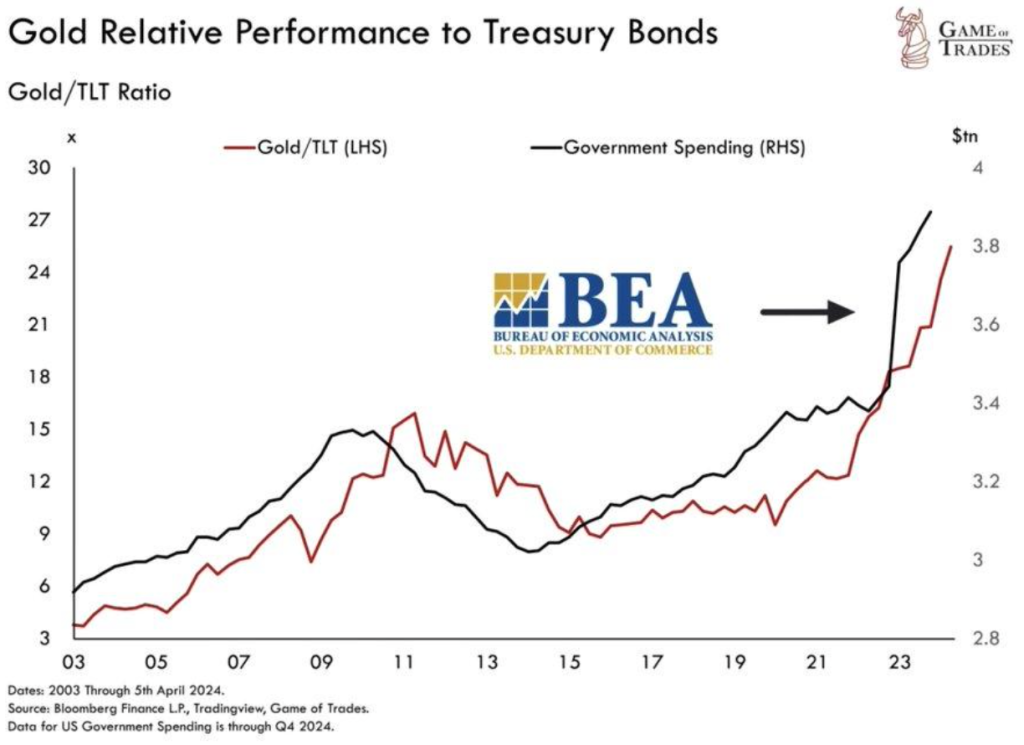
One of the clearest examples is the relationship between government spending and the price of gold. When you strip out the noise of monetary expansion and look at spending through a gold lens, the pattern is unmistakable: as credit expands, gold reflects the real cost of that expansion.
But the most important signal comes from the Dow-to-Gold ratio — a measure of how the stock market performs against an asset that cannot be printed.
Every major market shift of the last century has been marked by a decisive turn in this ratio.
It signaled the end of the 1920s boom, the inflationary unwinding of the late 1970s, and the collapse of the dot-com bubble in the early 2000s.
It has now turned again.
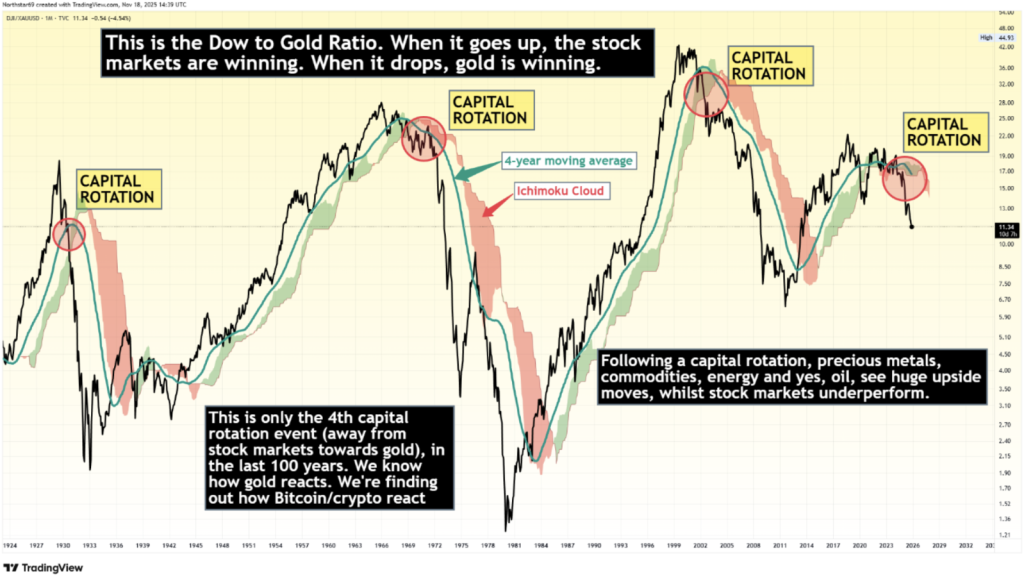
The ratio has broken below its four-year moving average — a simple, powerful signal that has preceded each prior Capital Rotation Event. And it has done so with the same sharp downward move that defined every previous shift away from overvalued equities and toward real assets.
The importance of this break cannot be overstated.
Markets can stay expensive for years when measured in dollars, but when they fall in gold terms, something deeper is happening. It means the market is no longer rising on its own strength but because the currency underneath it is weakening.
When the ratio falls, capital rotates. Not by choice, but by necessity.
Each previous CRE also ushered in a decade-long environment where precious metals, commodities, energy, and other real assets dramatically outperformed equities. The pattern is consistent, and the setup today matches it almost perfectly.
Once again, the Dow-to-Gold ratio has turned. Once again, the signal has flipped. And once again, the market is telling investors that the allocation environment ahead will not resemble the one behind.
Passive investing in equities is on notice.
Gold is already outperforming stocks.
And investors need a proactive strategy grounded in disciplined process and multi-decade evidence.If you are unsure how to transition, set up a call with me.