[et_pb_section fb_built=”1″ _builder_version=”4.23.1″ _module_preset=”default” global_colors_info=”{}”][et_pb_row _builder_version=”4.23.1″ _module_preset=”default” global_colors_info=”{}”][et_pb_column type=”4_4″ _builder_version=”4.23.1″ _module_preset=”default” global_colors_info=”{}”][et_pb_text _builder_version=”4.23.1″ _module_preset=”default” hover_enabled=”0″ sticky_enabled=”0″]“We Need To Be Very Careful With Interest Rate Cuts”
Thomas Hoenig, Former Federal Reserve Official and head of FDIC
[/et_pb_text][et_pb_text _builder_version=”4.23.1″ _module_preset=”default” hover_enabled=”0″ sticky_enabled=”0″]“Fed Regional Surveys reveal STAGFLATION to be emerging as THE dominant macro-economic trend”
Greg Weldon
[/et_pb_text][/et_pb_column][/et_pb_row][et_pb_row _builder_version=”4.23.1″ _module_preset=”default”][et_pb_column _builder_version=”4.23.1″ _module_preset=”default” type=”4_4″][et_pb_divider _builder_version=”4.23.1″ _module_preset=”default” divider_weight=”3px” module_alignment=”center” divider_style=”dashed” color=”#c6c6c6″ hover_enabled=”0″ sticky_enabled=”0″][/et_pb_divider][/et_pb_column][/et_pb_row][et_pb_row _builder_version=”4.23.1″ _module_preset=”default”][et_pb_column _builder_version=”4.23.1″ _module_preset=”default” type=”4_4″][et_pb_text _builder_version=”4.23.1″ _module_preset=”default” hover_enabled=”0″ sticky_enabled=”0″]
Excess liquidity boosts instability and elevates asset prices, while policy continues to damage the economy. Ideal conditions for a Bubble Where Price And Value Diverge.
This time is different! By initiating rate cuts at extended all time Global Dow highs the Fed implicitly confirms that equity indexes no longer provide a valuable economic signal.
As real capital shrinks, dependence on money printing builds.
Nvidia revenue growth rate is now declining. Key signal for a topping process for growth stocks, with negative trade signal.
Corporate cash will no longer support the recent pace of buybacks.
Wall Street earnings expectations through 2025 look too high as Wall Street prices in near perfection.
The Solution To The Policy Predicament a complete review of policy and shared sacrifice. How likely is that without a reset first?
[/et_pb_text][/et_pb_column][/et_pb_row][et_pb_row _builder_version=”4.23.1″ _module_preset=”default”][et_pb_column _builder_version=”4.23.1″ _module_preset=”default” type=”4_4″][et_pb_divider _builder_version=”4.23.1″ _module_preset=”default” divider_weight=”3px” module_alignment=”center” divider_style=”dashed” color=”#c6c6c6″ hover_enabled=”0″ sticky_enabled=”0″][/et_pb_divider][/et_pb_column][/et_pb_row][/et_pb_section][et_pb_section fb_built=”1″ theme_builder_area=”post_content” _builder_version=”4.23.1″ _module_preset=”default”][et_pb_row _builder_version=”4.23.1″ _module_preset=”default” theme_builder_area=”post_content”][et_pb_column _builder_version=”4.23.1″ _module_preset=”default” type=”4_4″ theme_builder_area=”post_content”][et_pb_text _builder_version=”4.23.1″ _module_preset=”default” theme_builder_area=”post_content” hover_enabled=”0″ sticky_enabled=”0″]
Fed Chair Powell Signals Rate Cuts Ahead in Jackson Hole Speech | WSJ
[/et_pb_text][et_pb_text _builder_version=”4.23.1″ _module_preset=”default” theme_builder_area=”post_content” hover_enabled=”0″ sticky_enabled=”0″]
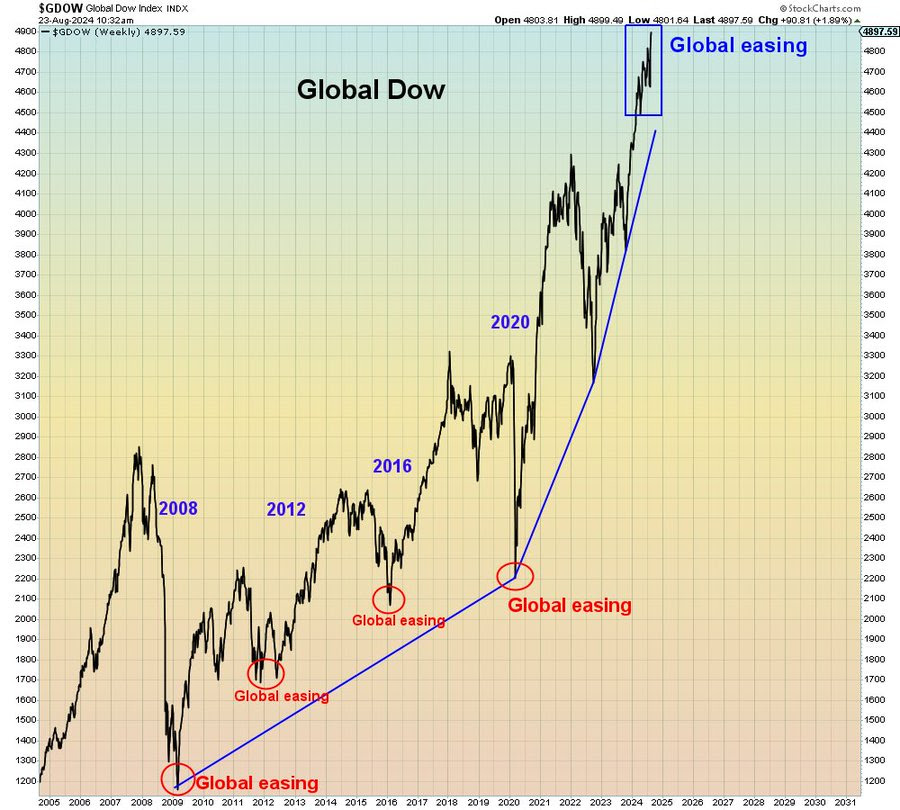
Powell could not have been clearer about his intention to start interest rate cuts in September. Take a look at where global equity markets are compared to other times when a global easing of policy was initiated.
Global Easing is different this time.
It’s happening at all time extended highs in the Global Dow. Usually it happens at the bottom of a stock market correction. Are the central banks implicitly signaling that the stock market no longer signals anything about the economy?
[/et_pb_text][et_pb_image _builder_version=”4.23.1″ _module_preset=”default” theme_builder_area=”post_content” title_text=”unnamed (7)” src=”https://cb-investment-management.com/wp-content/uploads/2024/09/unnamed-7.jpg” hover_enabled=”0″ sticky_enabled=”0″][/et_pb_image][et_pb_text _builder_version=”4.23.1″ _module_preset=”default” theme_builder_area=”post_content” hover_enabled=”0″ sticky_enabled=”0″]As you can see, cutting interest rates at the current time, is a complete break in behavior in terms of using the stock markets as an indicator of economic stress requiring an easing of interest rate policy.
No explanation has been forthcoming but perhaps central banks discount valuation as they themselves have purposely been boosting the stock market with liquidity and financial conditions. This could mean that stock markets have further to fall if they turn down.[/et_pb_text][et_pb_text _builder_version=”4.23.1″ _module_preset=”default” theme_builder_area=”post_content” hover_enabled=”0″ sticky_enabled=”0″]
Profit margins are still historically high so that is not the issue.
[/et_pb_text][et_pb_text _builder_version=”4.23.1″ _module_preset=”default” theme_builder_area=”post_content” hover_enabled=”0″ sticky_enabled=”0″]
[/et_pb_text][et_pb_image _builder_version=”4.23.1″ _module_preset=”default” theme_builder_area=”post_content” title_text=”b1″ src=”https://cb-investment-management.com/wp-content/uploads/2024/09/b1.png” hover_enabled=”0″ sticky_enabled=”0″][/et_pb_image][et_pb_text _builder_version=”4.23.1″ _module_preset=”default” theme_builder_area=”post_content” hover_enabled=”0″ sticky_enabled=”0″]
Wall Street’s earnings expectations are remarkably high into 2025
The link above goes a long way to showing that expectations seem out of line with multiple economic indicators, so perhaps they too should be discounted.
[/et_pb_text][et_pb_image _builder_version=”4.23.1″ _module_preset=”default” theme_builder_area=”post_content” title_text=”b2″ src=”https://cb-investment-management.com/wp-content/uploads/2024/09/b2.png” hover_enabled=”0″ sticky_enabled=”0″][/et_pb_image][et_pb_text _builder_version=”4.23.1″ _module_preset=”default” theme_builder_area=”post_content” hover_enabled=”0″ sticky_enabled=”0″]
However, Wall Street earnings expectations have historically been an unreliable indicator.
Certainly the labor market is finally turning down as the unemployment rate is accelerating.
[/et_pb_text][et_pb_image _builder_version=”4.23.1″ _module_preset=”default” theme_builder_area=”post_content” title_text=”b3″ src=”https://cb-investment-management.com/wp-content/uploads/2024/09/b3.png” hover_enabled=”0″ sticky_enabled=”0″][/et_pb_image][et_pb_text _builder_version=”4.23.1″ _module_preset=”default” theme_builder_area=”post_content” hover_enabled=”0″ sticky_enabled=”0″]
Perhaps the Fed is worried about buying support from corporation buybacks too.
[/et_pb_text][et_pb_image _builder_version=”4.23.1″ _module_preset=”default” theme_builder_area=”post_content” title_text=”b4″ src=”https://cb-investment-management.com/wp-content/uploads/2024/09/b4.png” hover_enabled=”0″ sticky_enabled=”0″][/et_pb_image][et_pb_text _builder_version=”4.23.1″ _module_preset=”default” theme_builder_area=”post_content” hover_enabled=”0″ sticky_enabled=”0″]
There has been no shortage of “recession indicators” over the last year so as we have shown.
It is when you look at the Negative Net Savings that you see that the scale of the problem may be much bigger than even the Federal Reserse and most investors seems to understand.
Negative Net Savings reveals a chronic global growth problem. Don’t miss Lacy Hunt’s remarkable description. But let’s set up the context.
[/et_pb_text][et_pb_image _builder_version=”4.23.1″ _module_preset=”default” theme_builder_area=”post_content” title_text=”b5″ src=”https://cb-investment-management.com/wp-content/uploads/2024/09/b5.png” hover_enabled=”0″ sticky_enabled=”0″][/et_pb_image][et_pb_text _builder_version=”4.23.1″ _module_preset=”default” theme_builder_area=”post_content” hover_enabled=”0″ sticky_enabled=”0″]
To be noninflationary, domestic funding must be matched by an increase in consumer savings. The next chart shows how net savings, while volatile, have collapsed in recent years. Even at their peak, they were not even close to covering the deficit, let alone funding the spendthrifts among them.
The plunge in savings at a time of high levels of nonproductive borrowing simply undermines the purchasing power of the dollar, which means that in time interest rates will rise to compensate.
[/et_pb_text][et_pb_image _builder_version=”4.23.1″ _module_preset=”default” theme_builder_area=”post_content” title_text=”b6″ src=”https://cb-investment-management.com/wp-content/uploads/2024/09/b6.png” hover_enabled=”0″ sticky_enabled=”0″][/et_pb_image][et_pb_text _builder_version=”4.23.1″ _module_preset=”default” theme_builder_area=”post_content” hover_enabled=”0″ sticky_enabled=”0″]
The decline of foreign investor investment puts the US dollar in an increasingly vulnerable position. US policy is putting the dollar in an increasingly unstable and unsustainable position.
[/et_pb_text][/et_pb_column][/et_pb_row][/et_pb_section][et_pb_section fb_built=”1″ theme_builder_area=”post_content” _builder_version=”4.23.1″ _module_preset=”default”][et_pb_row _builder_version=”4.23.1″ _module_preset=”default” theme_builder_area=”post_content”][et_pb_column _builder_version=”4.23.1″ _module_preset=”default” type=”4_4″ theme_builder_area=”post_content”][et_pb_text _builder_version=”4.23.1″ _module_preset=”default” theme_builder_area=”post_content” hover_enabled=”0″ sticky_enabled=”0″]
What The Huge Downward Revision In The Jobs Data Means For The Economy | Dr. Lacy Hunt
[/et_pb_text][et_pb_text _builder_version=”4.23.1″ _module_preset=”default” theme_builder_area=”post_content” hover_enabled=”0″ sticky_enabled=”0″]
0:00 Welcome Dr. Lacy Hunt 1:16 Macro picture 3:37 Downward revision in non-farm payrolls is significant 5:45 The 818,000 error is actually 915,000, according to Dr. Hunt’s model 9:00 The economy is deteriorating 15:24 Net national saving shows we have a problem 21:40 The seriousness of negative net national savings 25:00 Decline in the standard of living 34:50 Possible solutions, shared sacrifice 40:00 Fiscal dominance is a very real possibility 45:40 Fed is behind the curve 47:37 Where are we in the economic lifecycle 49:44 The global economy
[/et_pb_text][et_pb_video _builder_version=”4.23.1″ _module_preset=”default” theme_builder_area=”post_content” hover_enabled=”0″ sticky_enabled=”0″ src=”https://www.youtube.com/watch?v=GjU6dnvt_h4″][/et_pb_video][et_pb_text _builder_version=”4.23.1″ _module_preset=”default” theme_builder_area=”post_content” hover_enabled=”0″ sticky_enabled=”0″]
Summary
Economic MMT policy has driven the world economy into a chronic position with limited growth, instability and few good economic options. Global growth is in trouble and the inflationary bias of central banks is clear. Since the US left the gold standard and put central banks in charge in 1971, or even 1968, the change in inflation is clear.
[/et_pb_text][et_pb_image _builder_version=”4.23.1″ _module_preset=”default” theme_builder_area=”post_content” title_text=”b7″ src=”https://cb-investment-management.com/wp-content/uploads/2024/09/b7.png” hover_enabled=”0″ sticky_enabled=”0″][/et_pb_image][et_pb_text _builder_version=”4.23.1″ _module_preset=”default” theme_builder_area=”post_content” hover_enabled=”0″ sticky_enabled=”0″]
MMT drives the economy towards stagflation and there is no sign of a change of policy.
There will still be cycles in many countries and a wide range of assets to invest in. However, investors need to adapt their allocations away from just stocks and bonds, which were poor investments in the 1970s.
[/et_pb_text][/et_pb_column][/et_pb_row][/et_pb_section]